
Tired of exporting multiple CSVs each time you need to compare and interrogate your Google Search Console data? Well – not any more!
Identify your Impression & Clicks Movers & Shakers
Using Google Data Studio, our team has built a new tool that allows you to import your Google Search Console data for a 1 month or 3 month period and then compare performance against the previous period.
By doing so, you’ll be able to:
- Identify landing pages and search queries that have generated the most impressions and clicks
- Compare period on period impression/click percentage change across queries and landing pages
- Compare period on period absolute impression/click change across queries and landing pages
- Filter impression/click gains to landing page/query
- Export data for a bigger piece of analysis
How does it work?
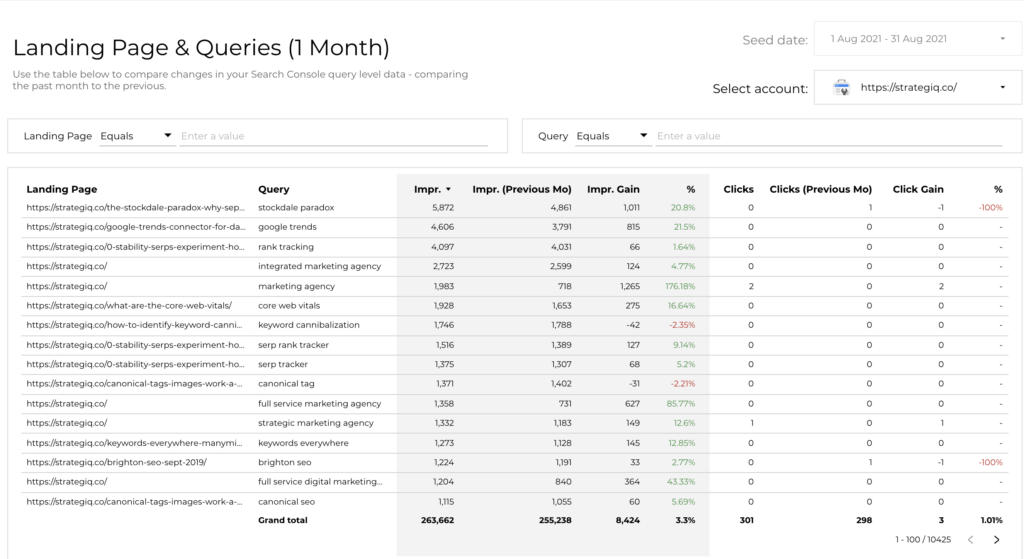
By selecting a data source in the top right corner, two data sources will be populated using your chosen GSC data set.
First, a data set will be built using the last period of x months. Second, the comparison data set will be built using the previous x months to the first data set. Data sets timeframes are selected based on the active Data Studio page (1 Month View or 3 Month View), your seed period is shown above the data selector. As an example, running the analysis in September would seed August and then compare to July on the ‘1 Month View’ slide, whereas ‘3 Month View’ seeds June, July & August, compared to March, April and May.
Now that the data sources have been built, the table is populated with landing pages and queries. For each of these click and impression metrics will be displayed, with both an absolute and percentage change column – where the table can be sorted by any of these columns. For ease of use, any positive changes will be highlighted green and negatives red.
Due to the background processes, initial load times can be upwards of 10 seconds!
Additionally, to drill down to specific queries or landing pages, filters at the top of the page can be used with a variety of matching options – equals, contains, starts with or regex.
Finally, right clicking the table will allow a CSV export.
How do I access the tool?
Easy! We’ve built it using Google Data Studio and it can be accessed here.
Feedback?
Tweet us @Strategiq or @joshcravvford


