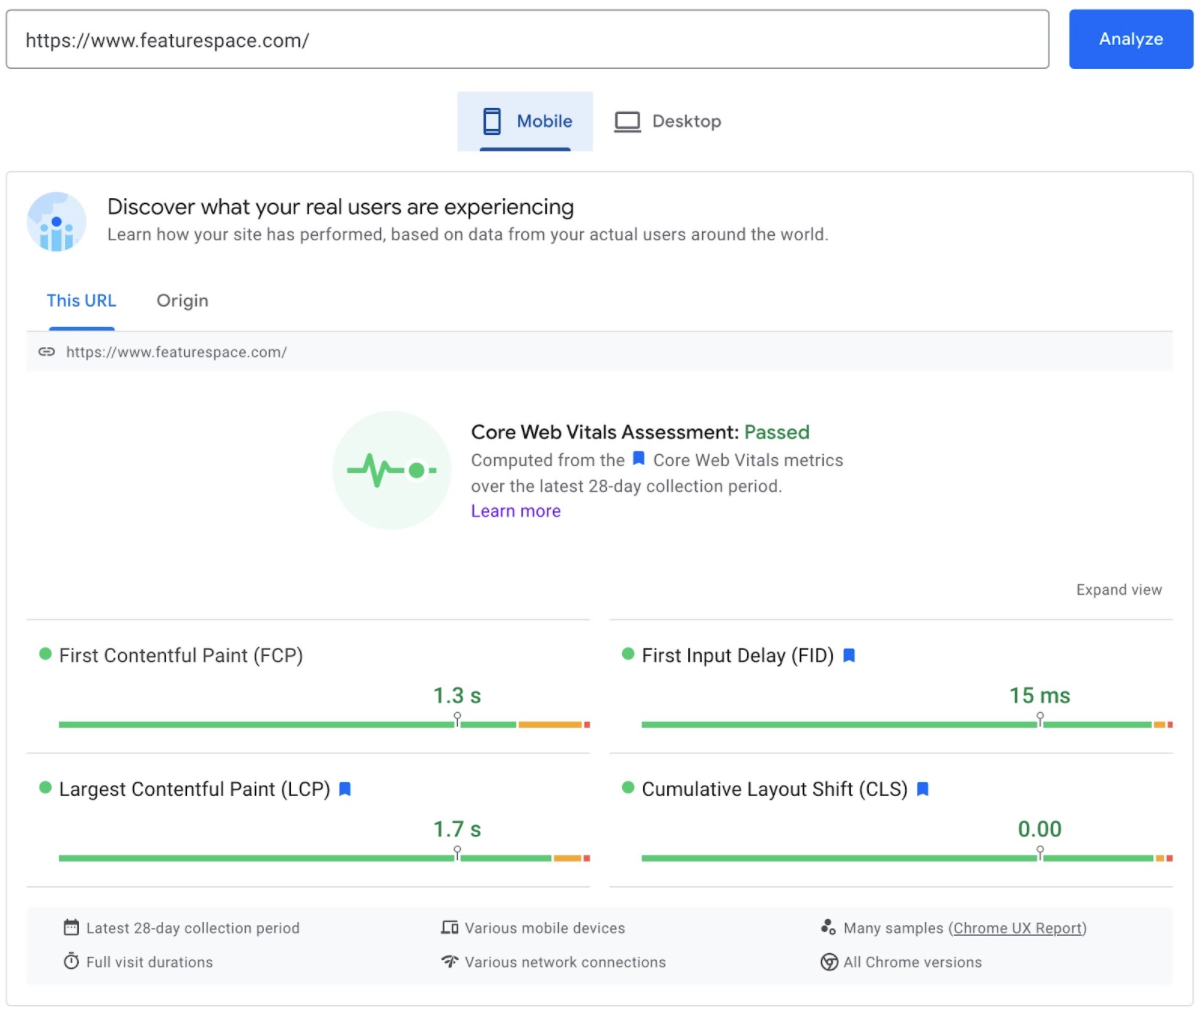
You may or may not be aware, but websites that receive enough visitors are blessed with a Core Web Vitals assessment:
This is a separate data set from Google’s standard performance scores. How so? Because the Core Web Vitals (CWV) scores are real data, taken from actual visitors to your site over the last 28 days (using the Google Chrome browser). However, the performance metrics are lab-generated scores in a simulated environment, so are likely to vary.
The entire database of CWV scores is available via the Chrome User Experience Report (CrUX).
The extremely excellent folks at HTTP Archive have then taken this report and made it even more interesting using their web technology detection, layering it with a Content Management System (CMS) comparison. So now, we can see how well certain technologies perform across the entire CrUX dataset.
This is known as the Core Web Vitals Technology Report.
So we’ve now got a load of graphs split into technologies and CWV scores. Now what? Now, we take a peek and see what we can learn!
As a world-class, award-winning agency, we were keen to see how WordPress scores, as that’s the primary CMS we use. Let’s take a look at some epic tables and charts, I know you want to.
Observation 1: WordPress is clearly the winner in terms of usage
Backed up by James Bavington’s excellent blog post here, WordPress is head and shoulders above all the other CMS / technologies out there, being a whopping 1100% higher than the next technology used (Shopify). James mentioned that it’s estimated that WordPress is used on almost half a billion websites. Insane numbers.
Observation 2: WordPress’ “% good CWV” is second from last
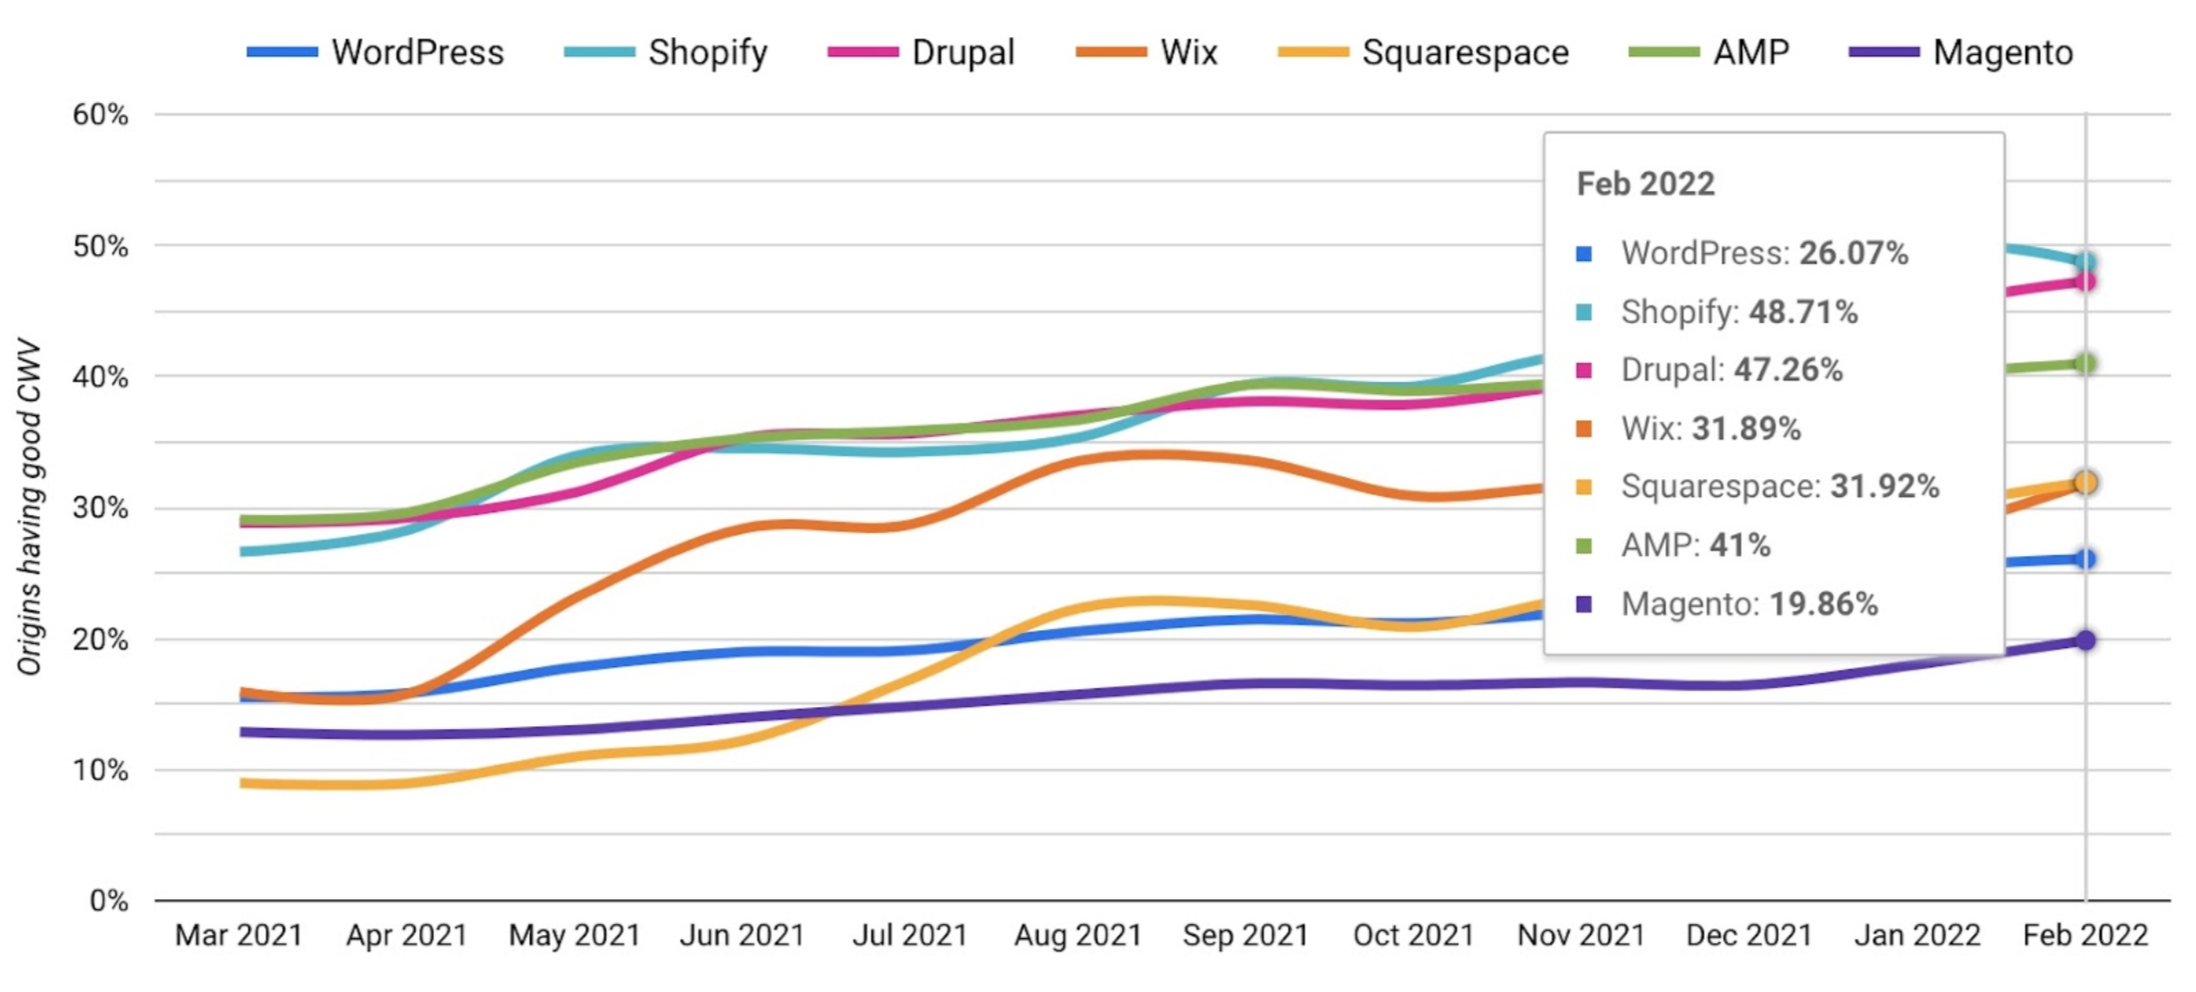
Despite the high usage, it has a relatively poor “% good CWV” score. Why? Well, there’s likely a number of reasons.
Firstly, just the sheer number of sites it powers means that there is a higher chance that sites won’t pass CWV.
Due to it being open source software (unlike Shopify), people can do whatever they want with it – which usually comes along with poor quality development. It’s also such an old technology, released in 2003, so out of 500M websites, there’s most likely some very old ones in that mix.
Another big negative for WordPress is the prevalence of pre-built themes. Yes it’s easy to buy a theme for $40 and pop it on a WordPress install, but more often than not, they are bloated, slow, and difficult to use. They very rarely score well straight out of the box.
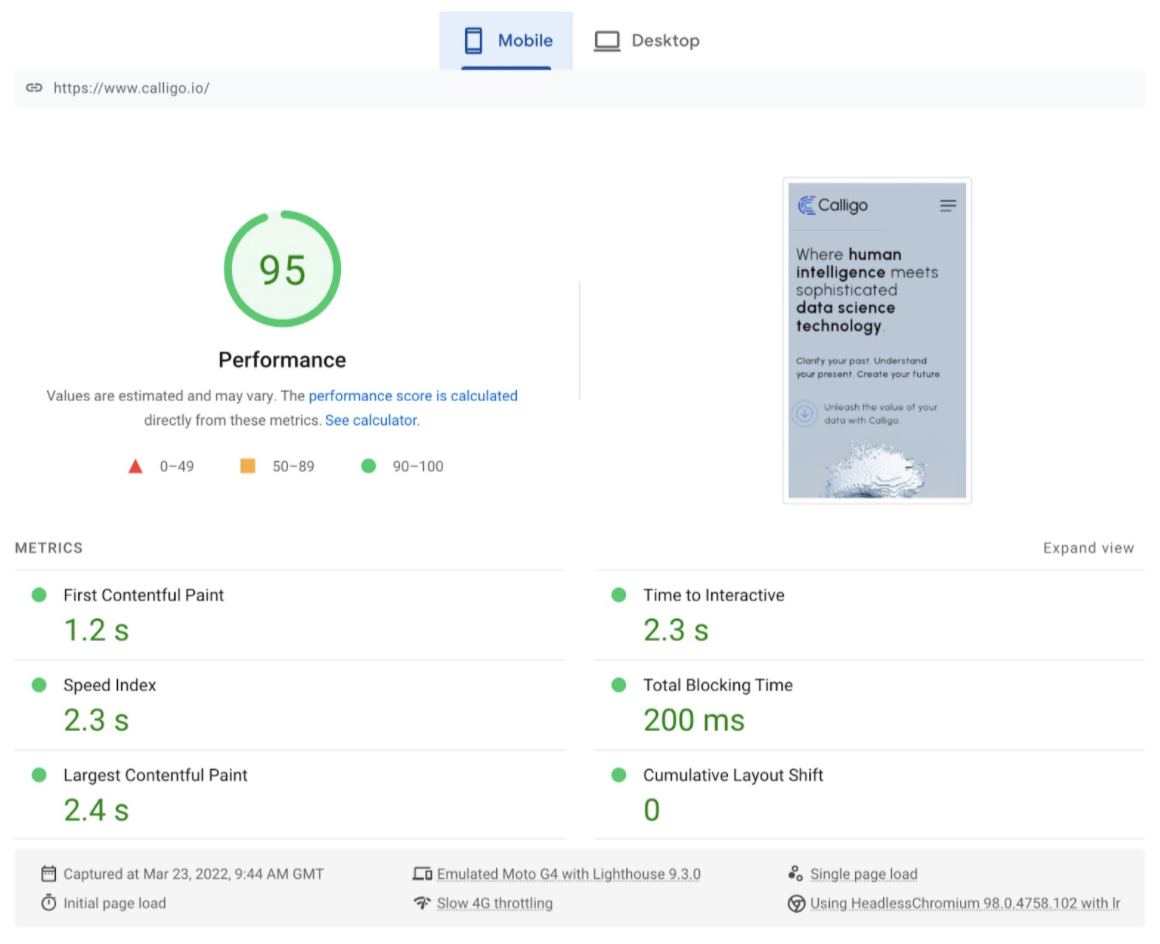
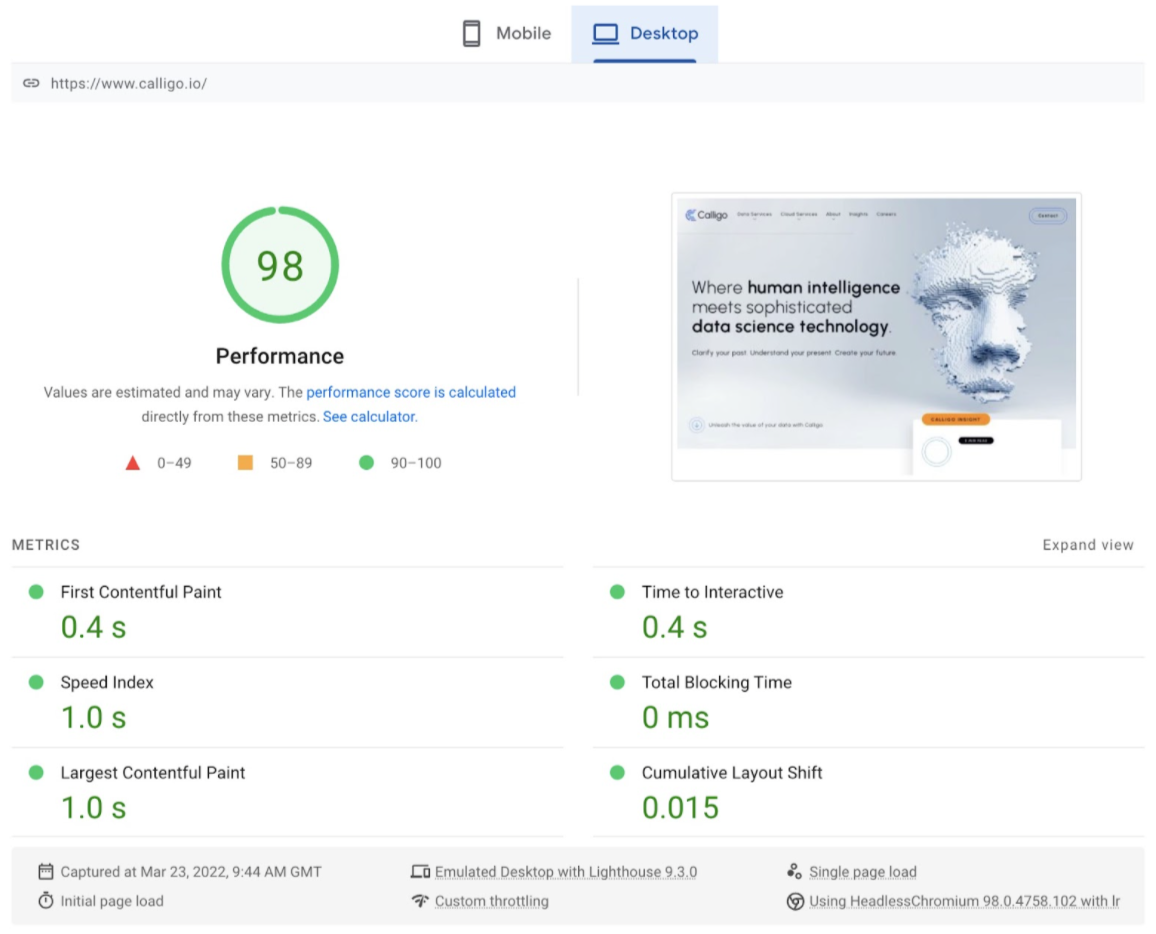
However, rest assured that if you use an award-winning agency (like StrategiQ, cough), your website will break this mould and will perform top of it’s class:
Observation 3: Desktop scores better, but not as much as expected
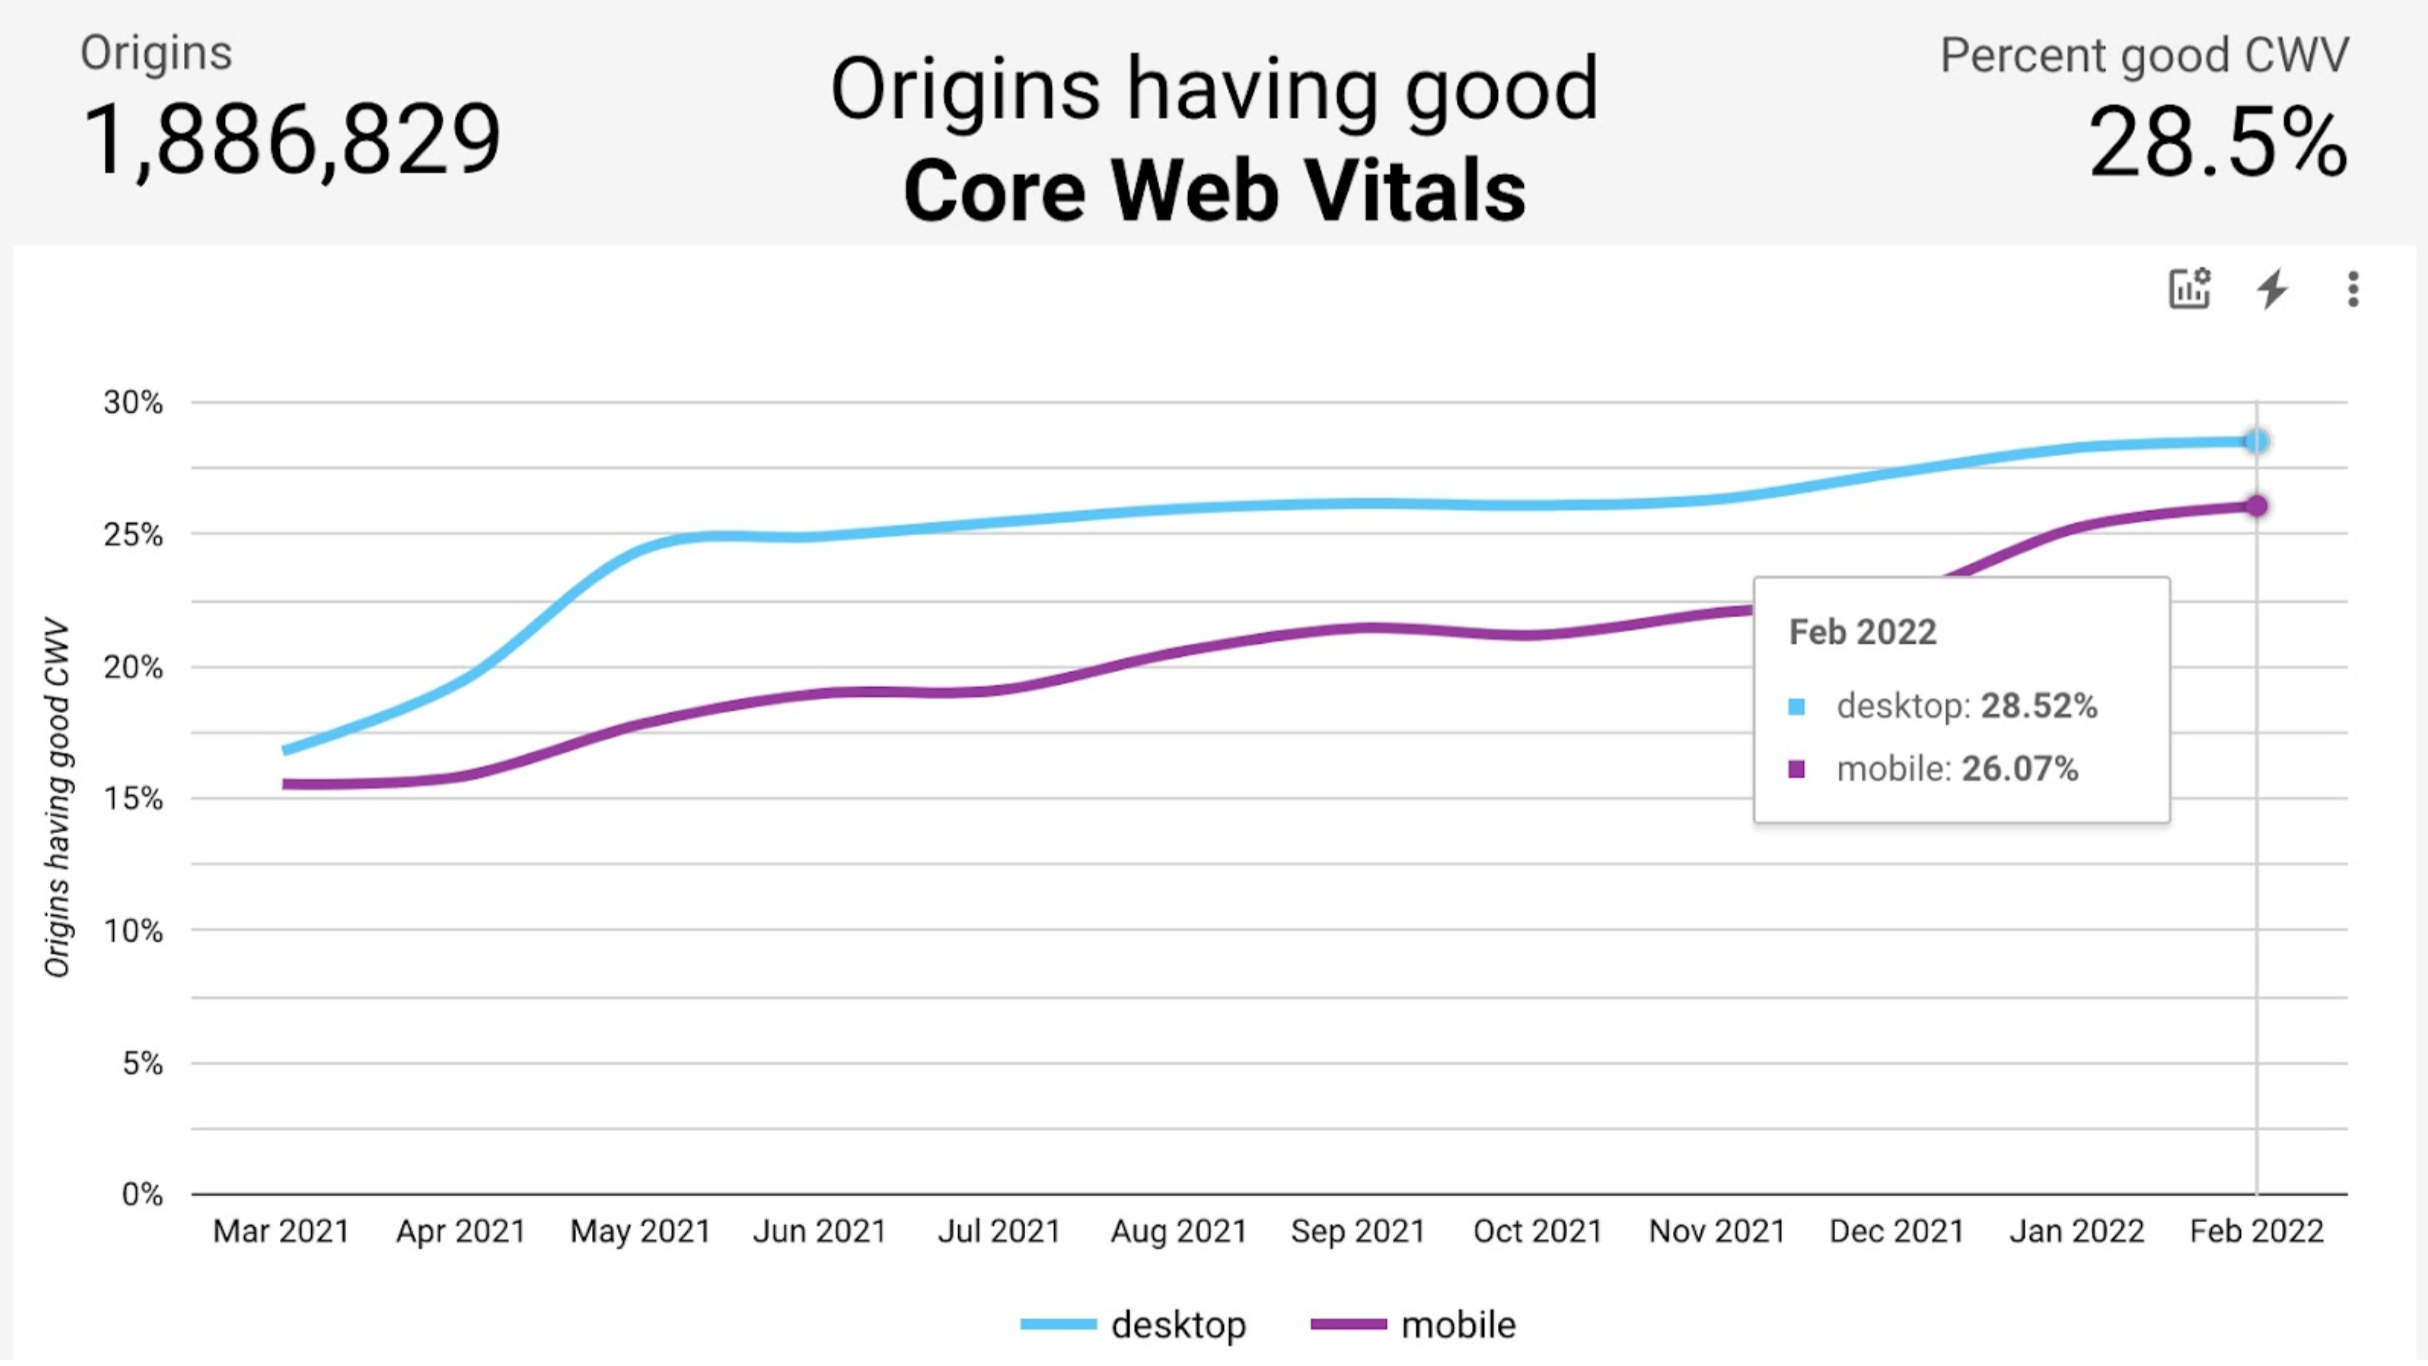
If you ever do a Lighthouse Audit or PageSpeed Insights test, you’ll notice that desktop pretty much always scores higher than mobile – oftentimes much higher. This is due to mobile devices tend to be restricted in terms of data connectivity and processing power when compared to a computer connected to wifi.
So to see that desktop’s % good CWV is only 2.5% higher than mobile is quite interesting – it really does show the focus many responsible site owners have on ensuring their site performs well on mobile.
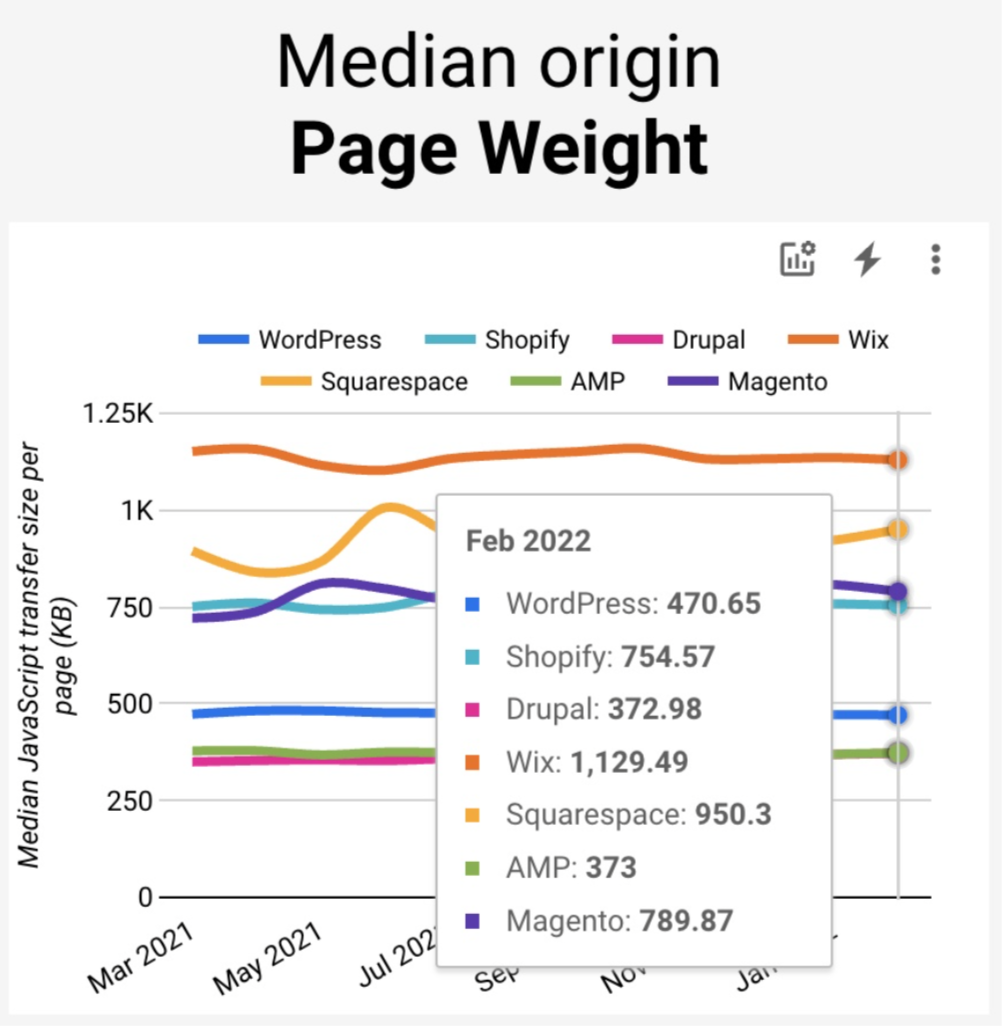
Observation 4: WordPress’ Median Origin Page Weight isn’t too bad
This did surprise me somewhat! WordPress is second only to Drupal (we’re going to ignore AMP, as that’s Google’s own mobile-focused technology).
However, topping that chart is Wix and Squarespace, two DIY / “build-it-yourself” platforms – both loading on average around a whopping 1MB of javascript on every page! This leads us on to…
Observation 5: Wix and Squarespace (shudder)
There’s no denying that they are both very popular platforms that serve a purpose, but if you’re a business who wants their website to perform well, then we simply cannot recommend them. They are exceptionally difficult to work with, tend to look low-budget / amateur, and are not built to the best standards.
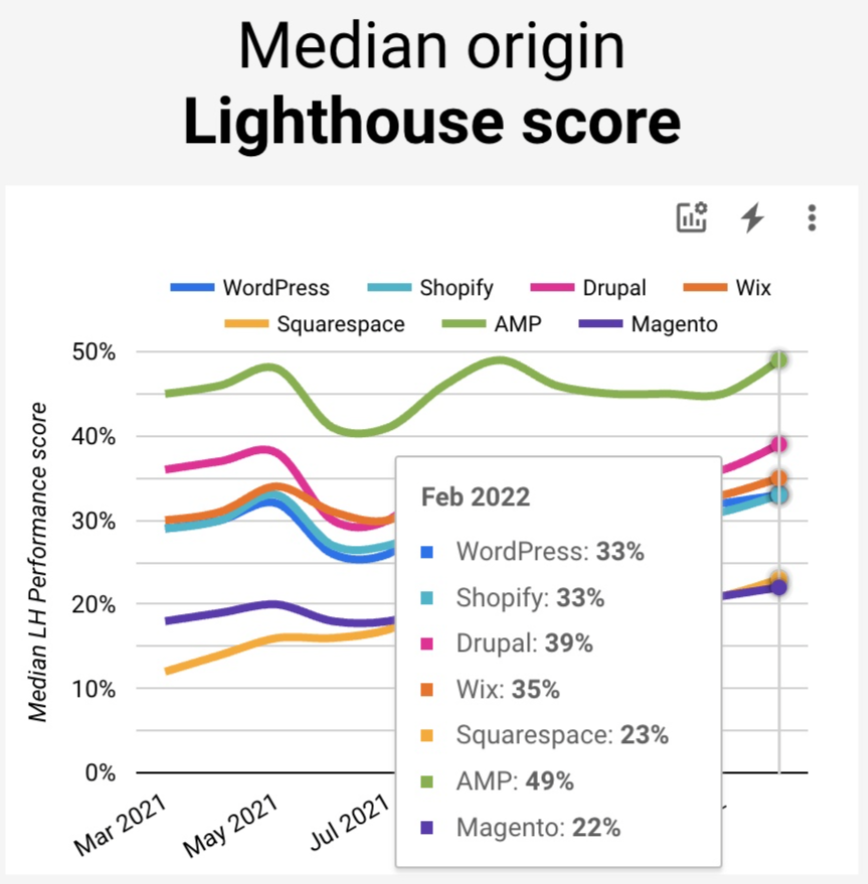
Observation 6: Median Lighthouse score is quite a close battle
Again, let’s ignore AMP. Once that’s out of the equation, the next batch of technologies are actually rather close together. Drupal just nicks it at a median Lighthouse score of 39%, and the next batch battle it out around the 33-35% mark.
Observation 7: Shopify have got their ducks in a row
In case you’re not aware of that metaphor, it means to be well prepared or well organised for something that is going to happen.
Shopify have certainly done that in terms of web performance and CWV scores, consistently coming top of the “% good CWV” chart since September 2021.
Of course, it helps that they host all their sites and have complete control over their tech stack, so they have much more control over how their sites perform than WordPress. But it’s still very impressive to see how they’ve reacted to the shift to how important CWV scores are.
Observation 8: Magento is a big, heavy beast
Magento is a tremendously powerful eCommerce platform. But with great power, comes great responsibility load times.
Propping up the charts at the very bottom for both % good CWV and median Lighthouse scores, it requires a lot of work to get it performing as well as the other platforms. Of course, it does a lot that the others don’t, so if you’re currently using Magento the suggestion is to work on improving how it performs rather than throwing in the towel (another excellent metaphor).
Observation 9: Incredible progress, but there’s still plenty of work to do
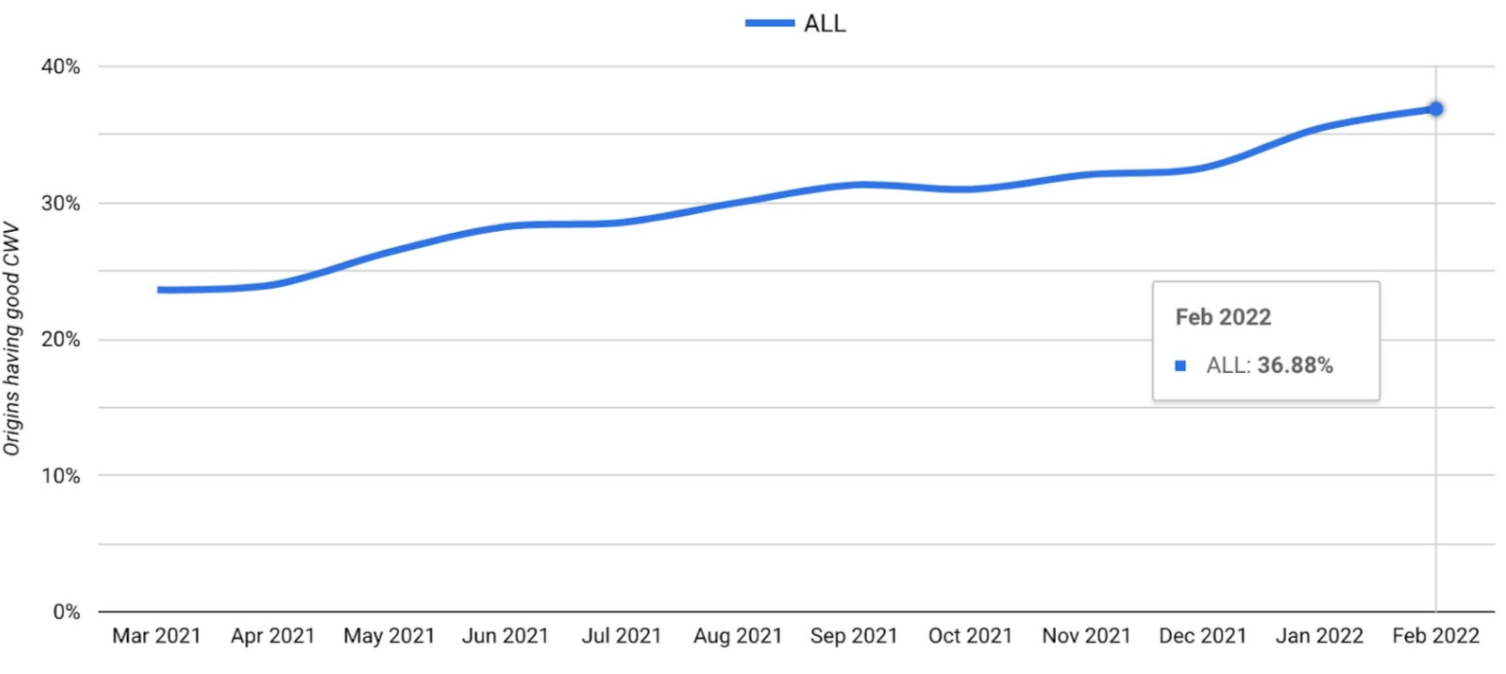
With all technologies taken into account, only a third of websites have a good CWV. It’s clear from the chart that excellent progress has been made over the past year – as that number was at 23% in March 2021.
We aim to do our part in ensuring every site we launch passes Web Core Vitals!
Final comments
It’s always good to get a top level view of how our sites compare to the norm out there. The two examples shared in this article, Featurespace and Calligo, both pass Core Web Vitals – and your site can too.
Do you want your site to be an award-winner? Simply get in touch with us to discuss your requirements and we can make sure it has ultimate performance.

