Playing an integral role in any digital marketing activity, your Google Analytics account must be healthy and record data with a high level of accuracy and quality.
Typically, identifying issues within an account is a lengthy process with multiple reports to check and validate which can lead to missed errors and less time spent using data to drive your strategies.
This is why I built the Google Analytics Data Quality Checker – a simple Data Studio dashboard to enable quick analysis of data health to understand the quality and reliability before analysis.
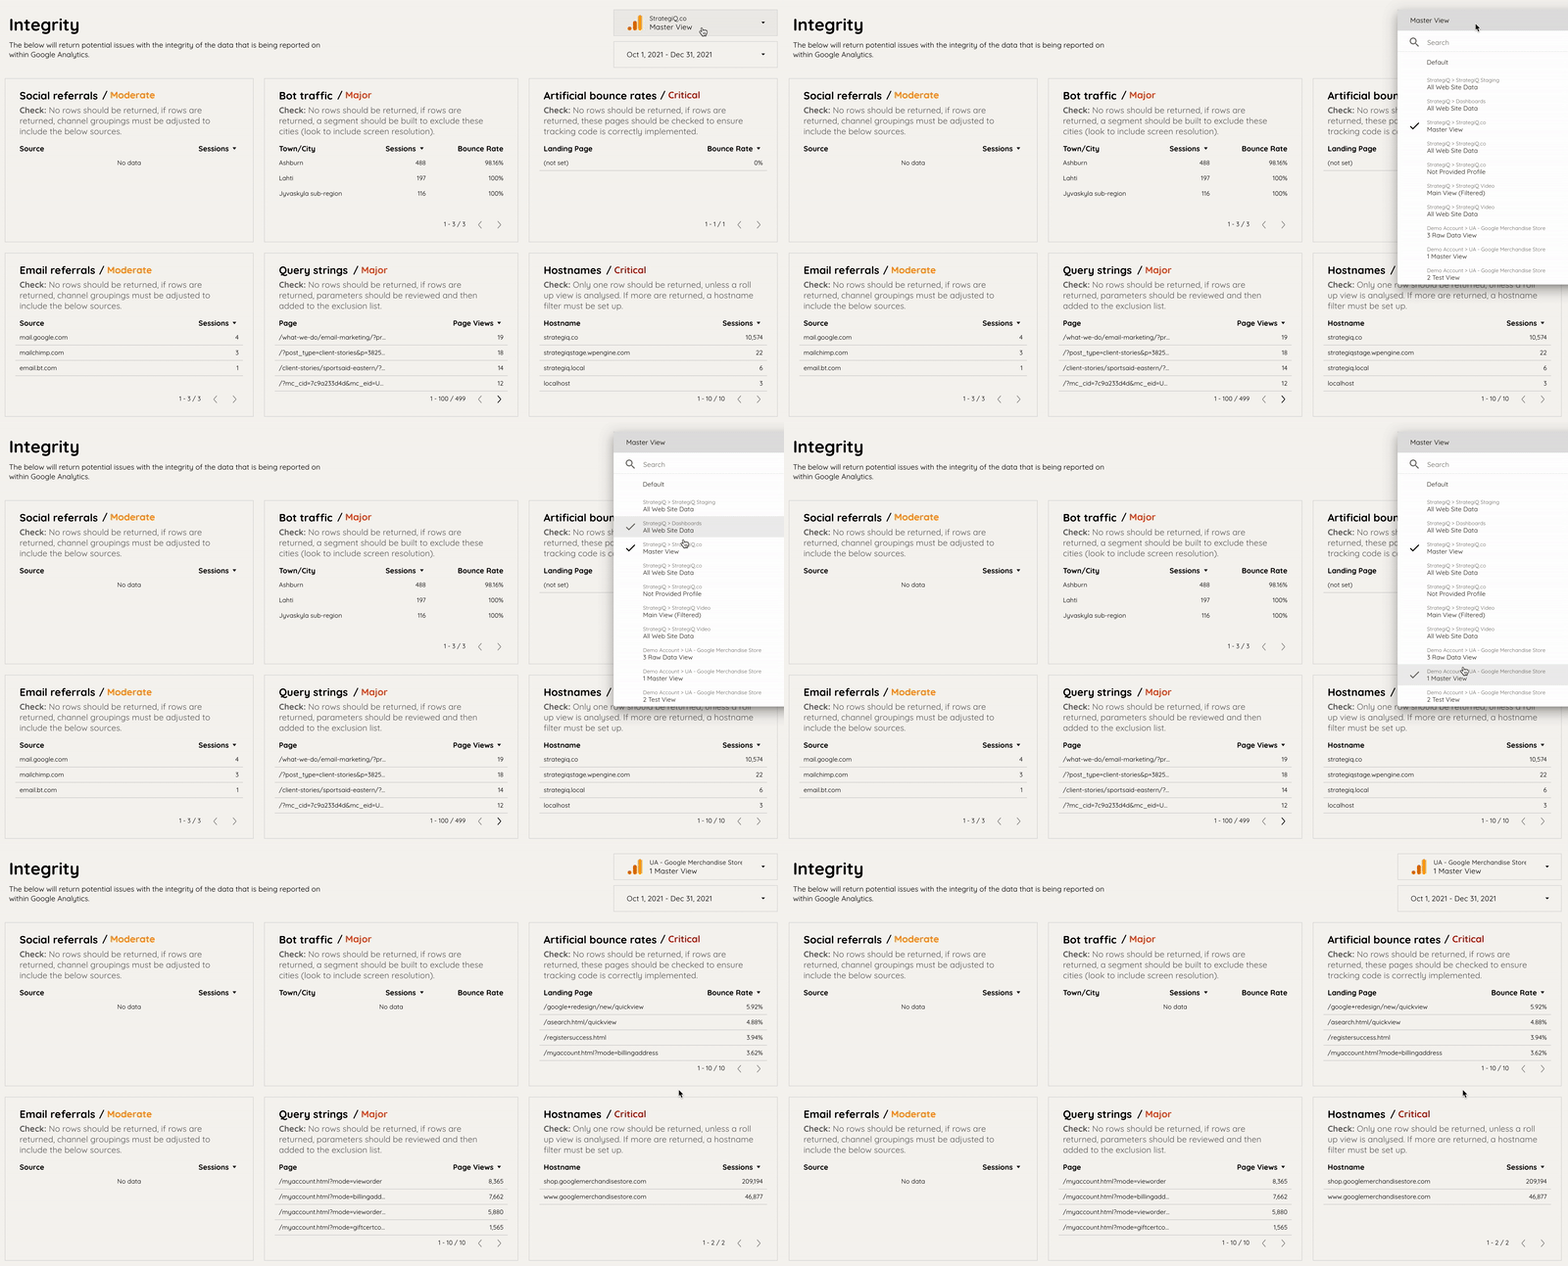
It’s easy to get started – simply load the dashboard, and use the picker in the top corner to select the account to review.
Performing 18 checks, the dashboard will return a series of data points that will identify areas for further review.
What does the dashboard check?
Integrity
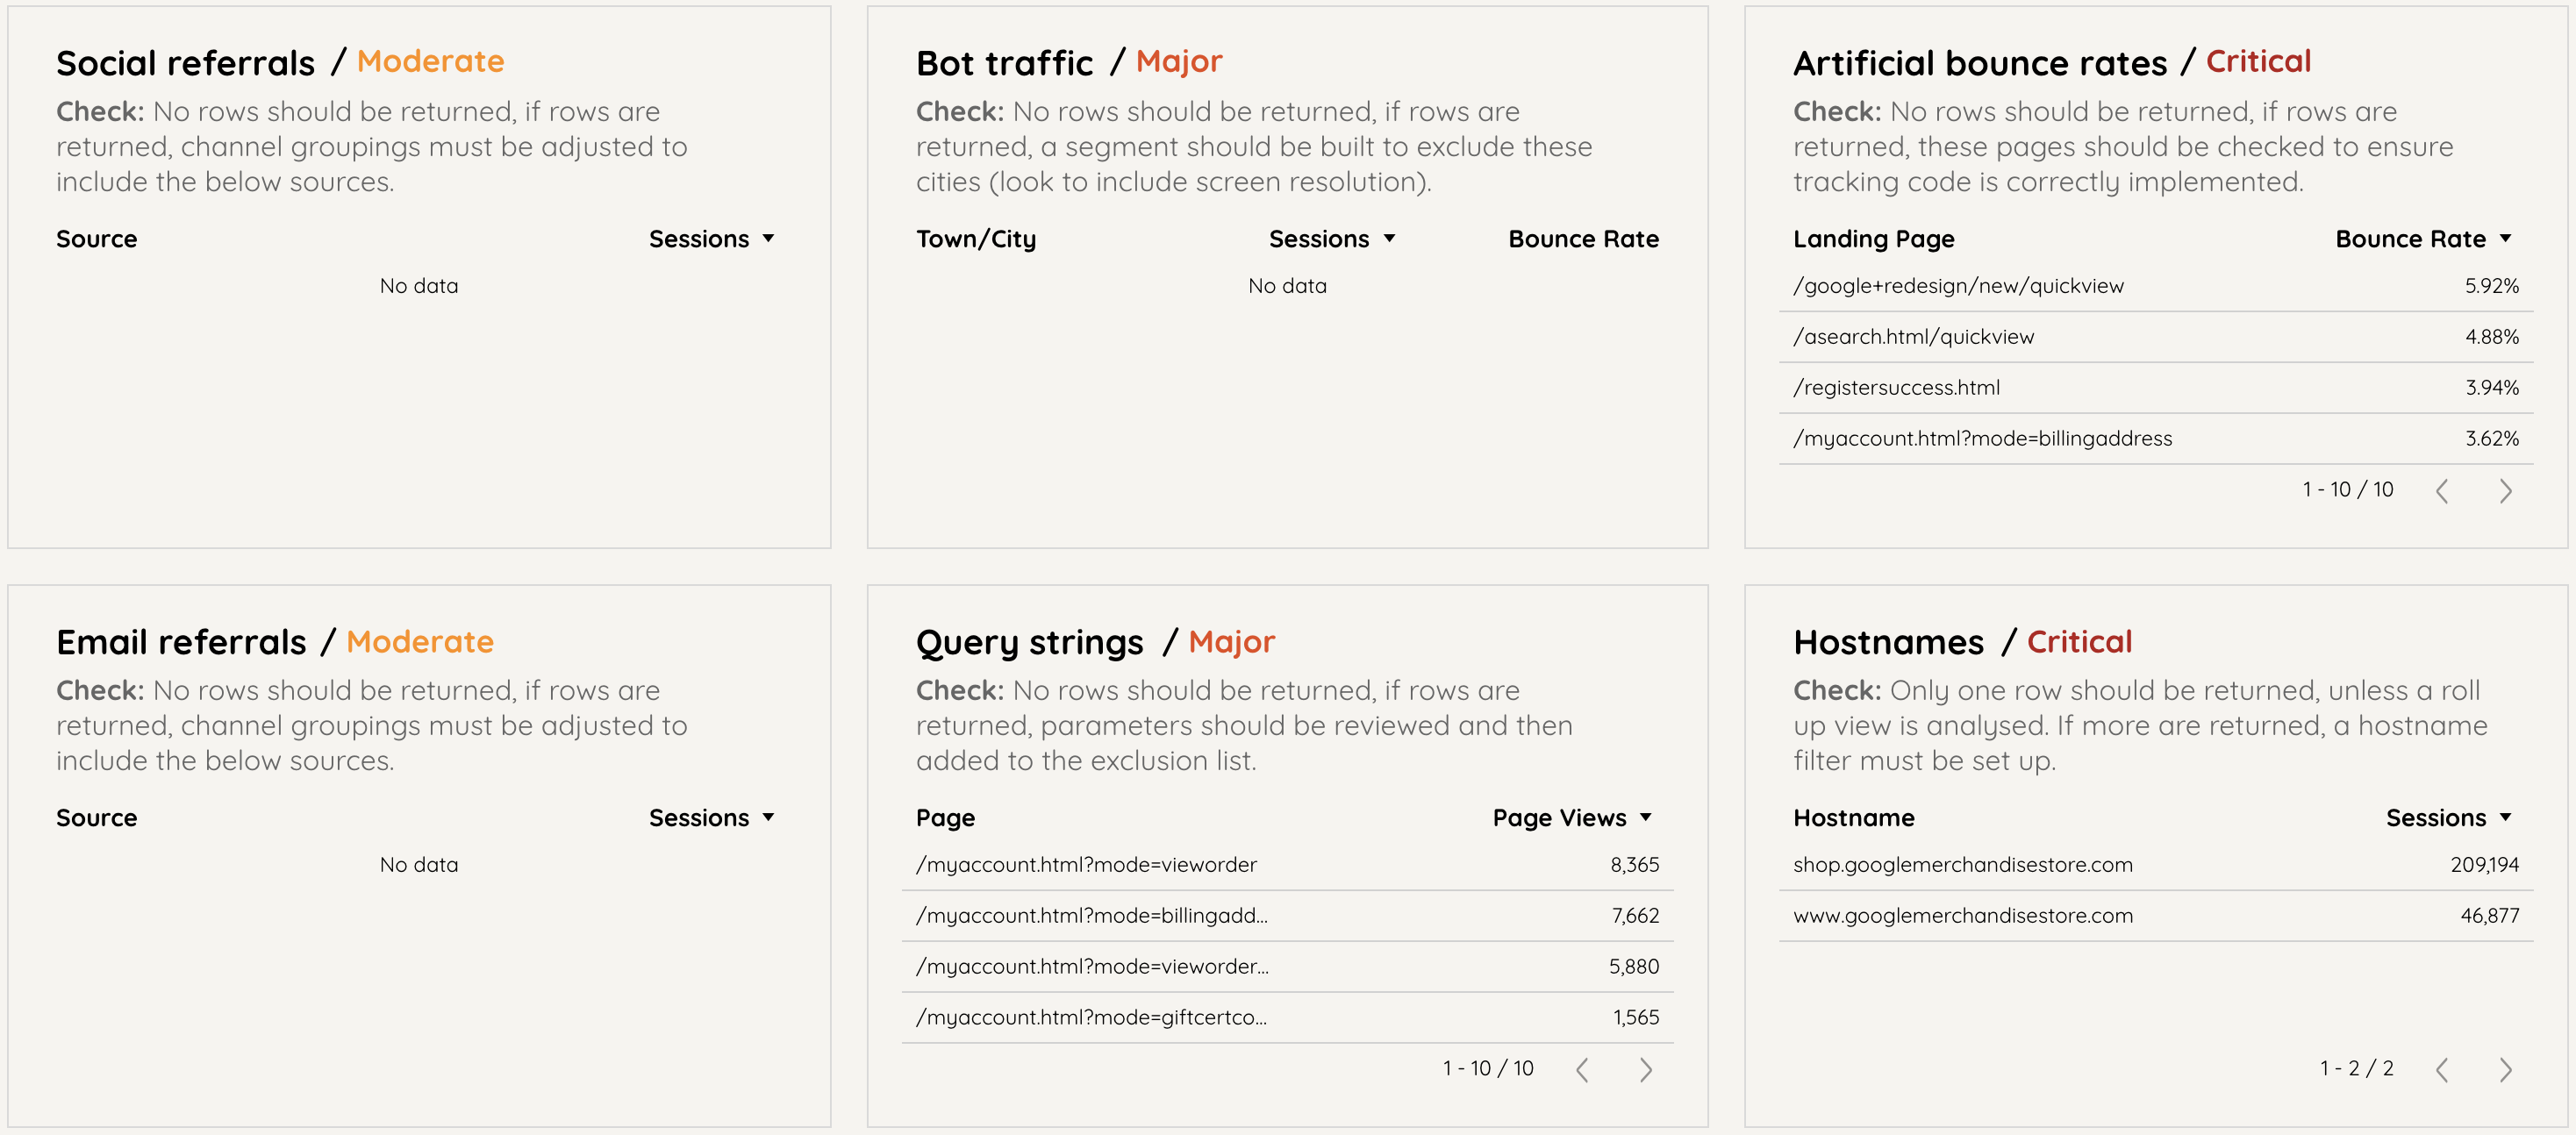
Social referrals
Identifying any occurrences of social traffic being categorised as referral.
Why is it important? – Mis-categorised social traffic will lead to the risk of under/overvaluing the role of social in your marketing funnel.
Email referrals
Identifying any occurrences of email traffic being categorised as referral.
Why is it important? – Mis-categorised email traffic will lead to the risk of under/overvaluing the role of email in your marketing funnel.
Bot traffic
Reporting cities where bounce rates are high and sessions are above 100 in a 3 month period.
Why is it important? – Bot networks will inflate data with poor quality traffic, meaning lower conversion rates and higher bounce rates.
Query strings
Highlighting pages where a query string is included in the page path.
Why is it important? – Each unique query string will create a new data row leading to a high cardinality and leading to a lengthy analysis process.
Artificial bounce rates
Identifying pages where bounce rates are below a low threshold and have over 50 sessions.
Why is it important? – Pages identified will potentially have an issue with tracking codes – often installed twice or incorrect interaction settings. Bounce rates will be incorrect and often indicates deeper issues with your setup.
Hostnames
Returning all the hostnames (domains) that have registered traffic in your Google Analytics account.
Why is it important? – By default, Google Analytics is open to any website – meaning data could be erroneously or maliciously blended with your data. Unmanaged, this could easily lead to the misanalysis of data.
Configuration
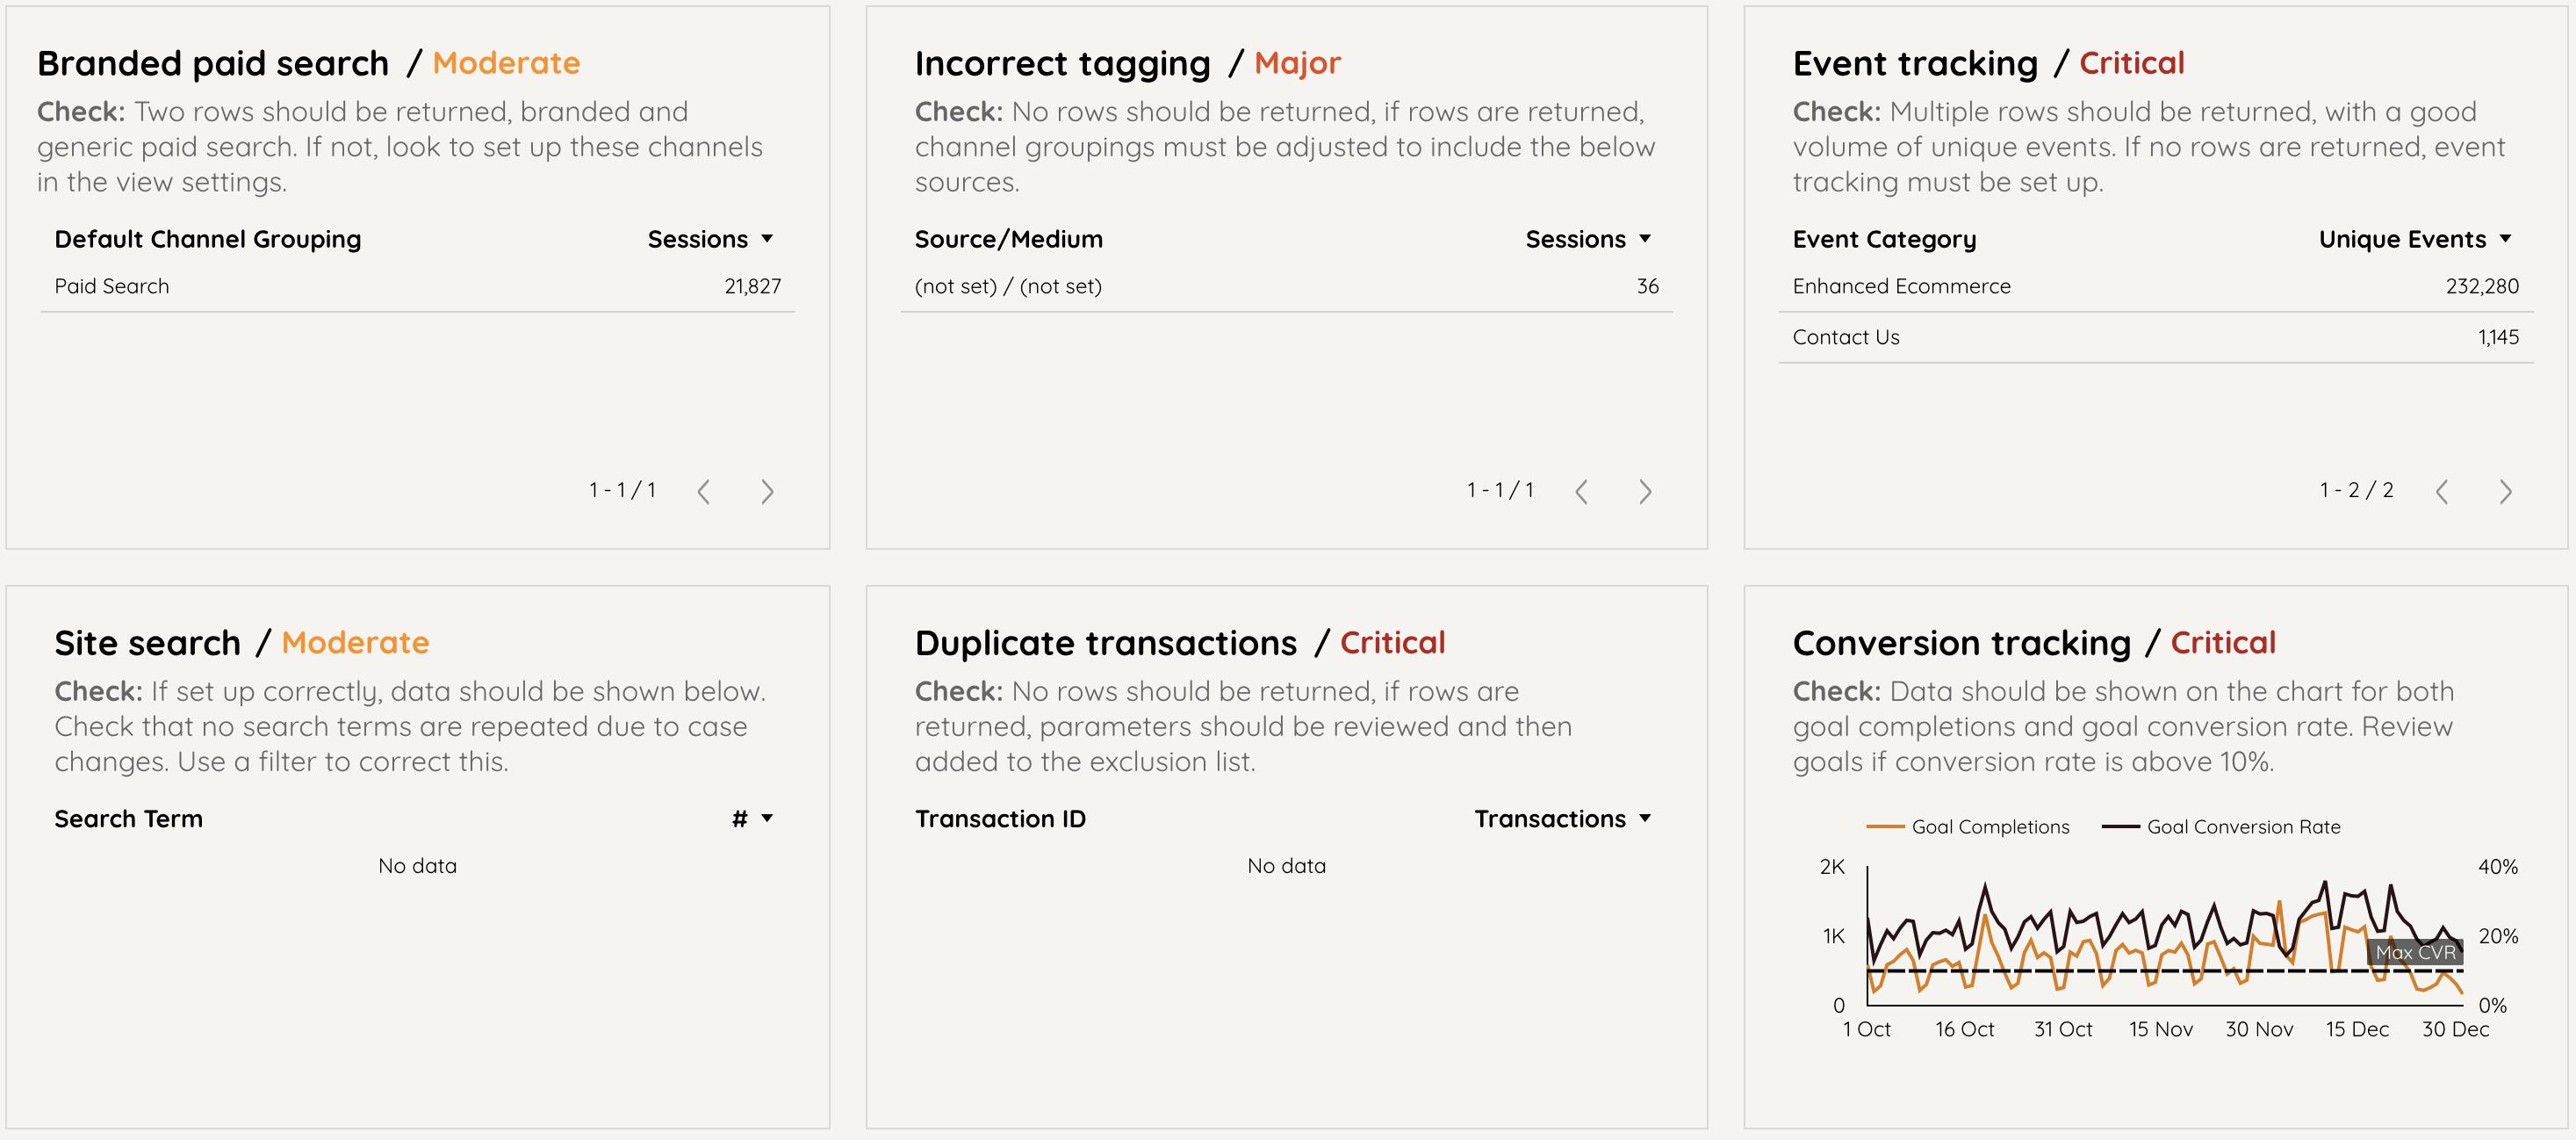
Branded Paid Search
Displaying all channels that contain “Paid Search”
Why is it important? – Default channels will group paid search regardless of search query – users accessing via branded terms will behave differently to those from generics and thus should be analysed separately.
Site search
Surfacing all search terms tracked by the default search reports.
Why is it important? – Site search provides invaluable data relating to what your audience is searching for – but cannot find. You should also check here for the casing – by default, Google Analytics is case sensitive and will report multiple rows.
Incorrect tagging
Showing any traffic source/medium that is unrecognised by Google Analytics and thus grouped as (other).
Why is it important? – Tagging is a fundamental component of good data. It’s imperative that tags are recognised and fed into the correct channel. If not, you will under or overvalue acquisition sources that are missing from the appropriate channel grouping.
Duplicate transactions
Reporting any transaction ID where the count of transactions is greater than one.
Why is it important? – If Google Analytics has recorded unique transactions multiple times, your e-commerce reports will be inflated. As a result, your conversion performance data will be severely impacted and will lead to mis-analysis of performance.
Event tracking
Integral to Google Analytics, event tracking will surface all event categories currently tracking on your website.
Why is it important? – A comprehensive set of tracked events will significantly improve your ability to understand how users are interacting with your website. At a minimum, you should be tracking scroll depths, form completions, document downloads, outbound clicks, and clicks on email/call links.
Conversion tracking
Displaying the goal completions and goal conversion rates over 3 months.
Why is it important? – Fundamental to Google Analytics, goals allow you to mark significant on-site actions and then analyse performance for each action across most data points within Google Analytics. Without goals, performance analysis is significantly harder. Goals should be significant actions and business related.
PII
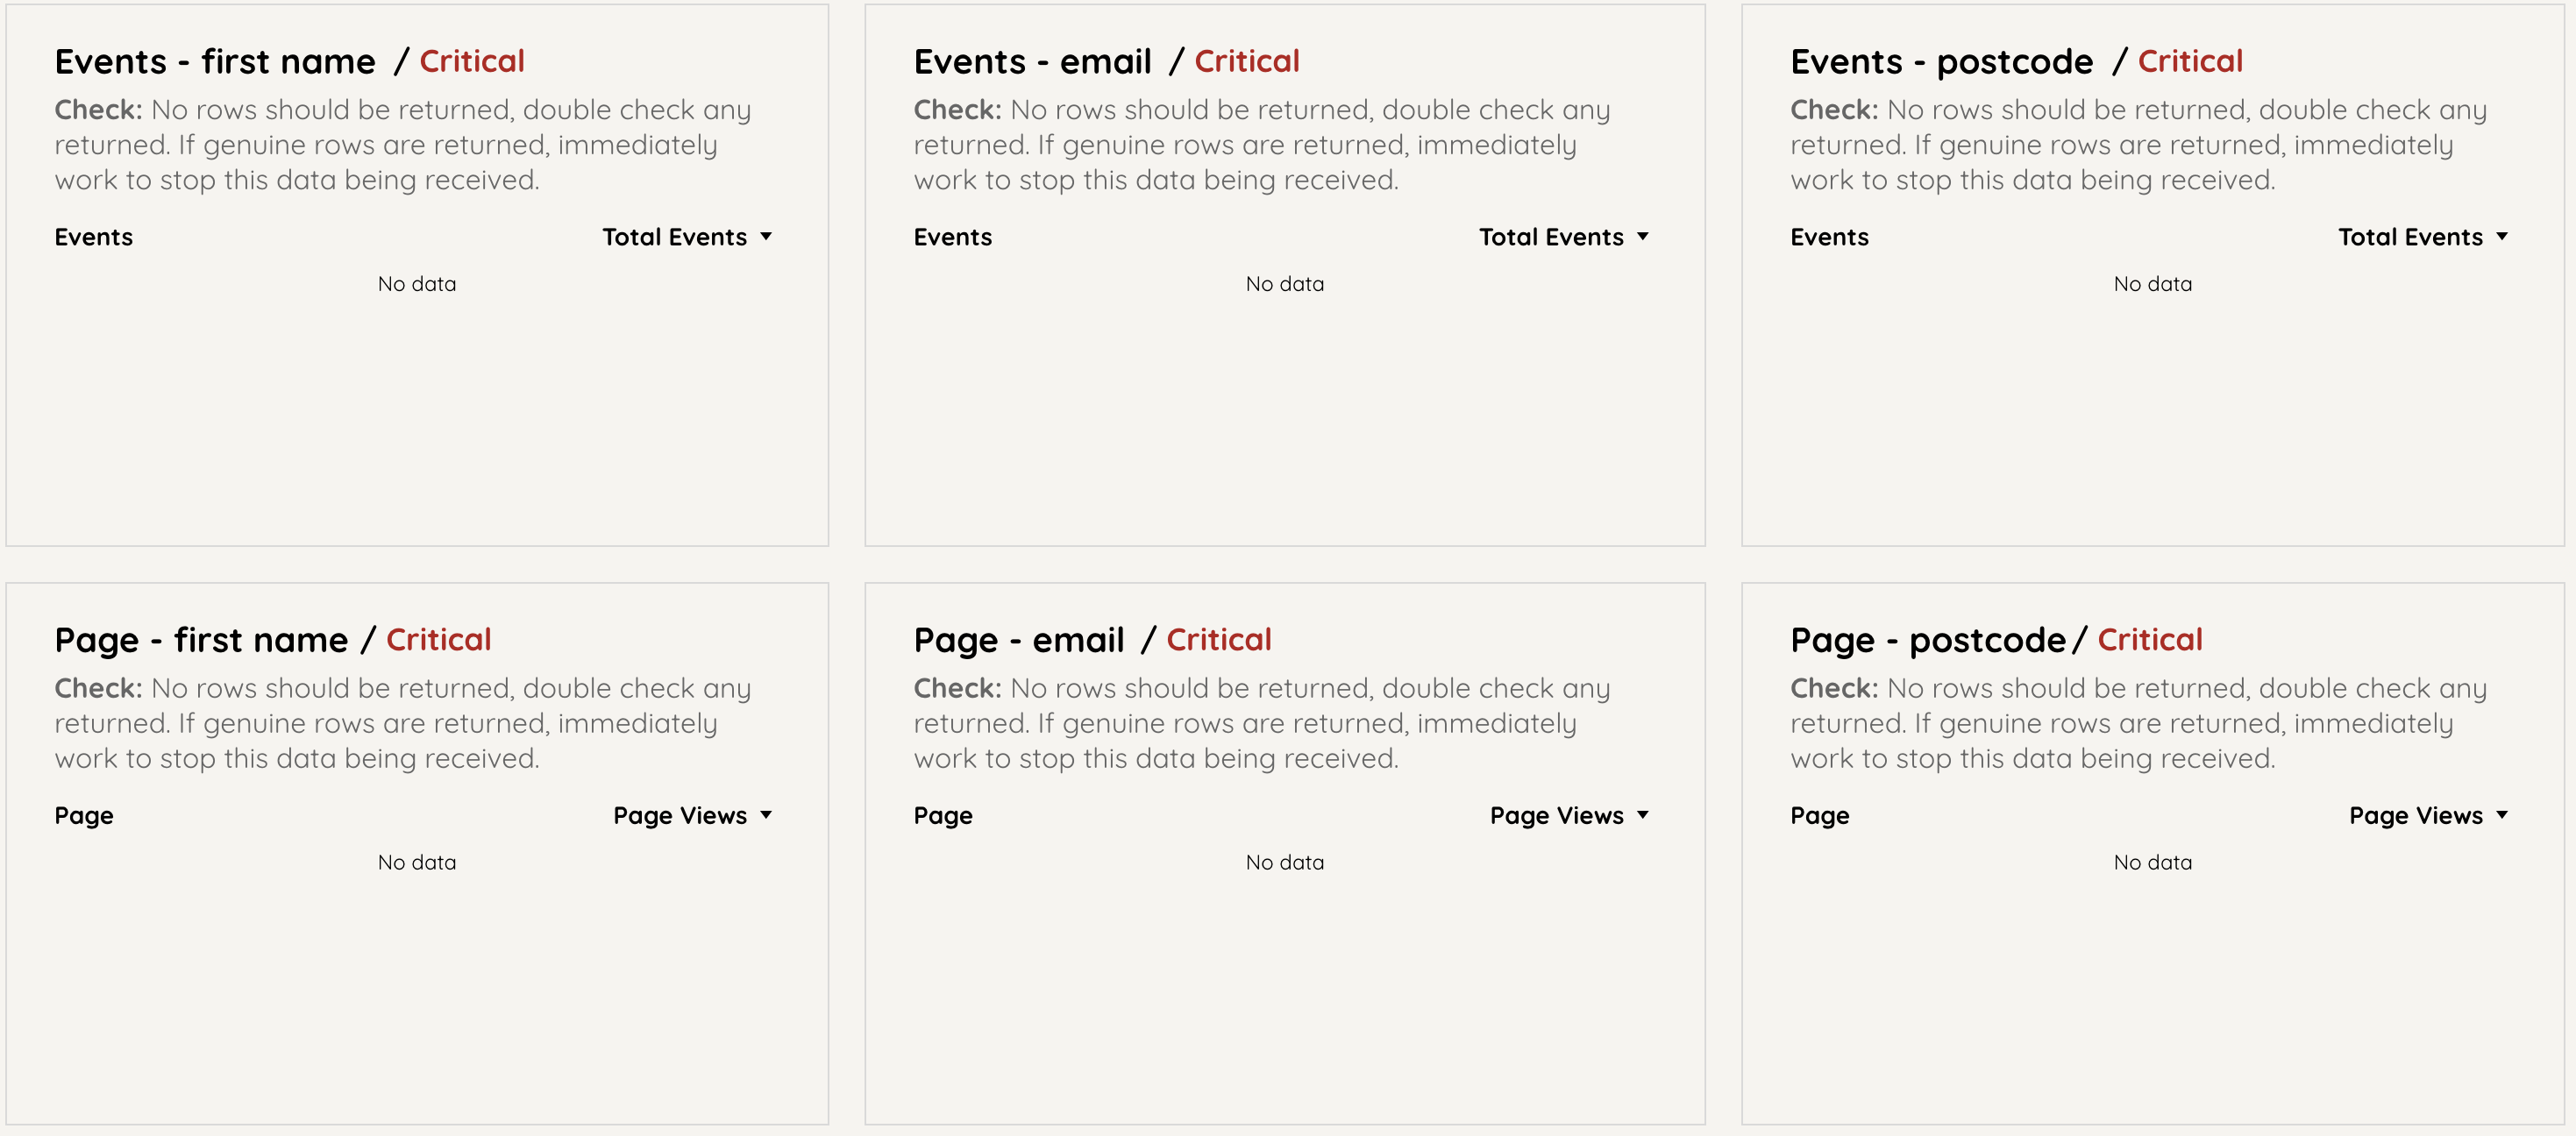
Displaying six checks across key areas of Google Analytics (events & URLs) where checks are carried out for personally identifiable information. Due to the need for open filtering, always sense check the returned rows as false positives will appear.
Why is it important? – Recording PII violates Google’s Terms of Service and can lead to serious consequences. Therefore, it’s imperative that you avoid recording this data within your Google Analytics account. If any positives are returned, action these as soon as possible.
And that’s it!
A set of actionable checks that will help you to quickly check the validity of your data.
If you’ve found some concerns with your data – reach out to the team and let’s start the journey to better, more trustworthy data!
How do I access the tool?
Easy! We’ve built it using Google Data Studio and it can be accessed here – Start Analysing
Feedback? – Tweet us @StrategiQ or @joshcravvford


